
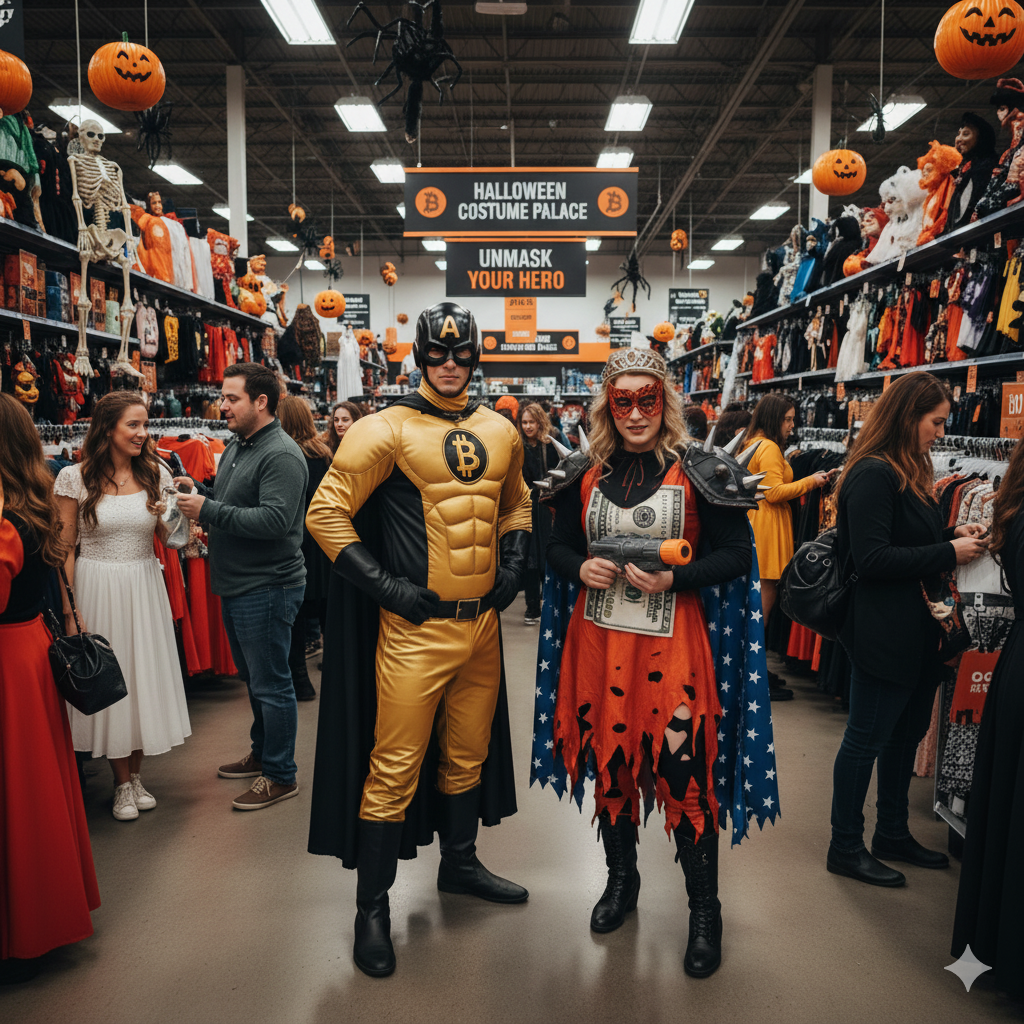
Overview of Halloween’s Economic Impact
Halloween has evolved from a niche holiday into a major driver of consumer spending in the US, with growing participation fueling billions in annual economic activity. According to the National Retail Federation (NRF), nearly 73% of Americans plan to celebrate in 2025, up from 72% in 2024, reflecting sustained and increasing interest. This enthusiasm has translated into record-level spending, supporting retail, manufacturing, agriculture, tourism, and seasonal jobs. The overall financial benefit stems from direct consumer expenditures (e.g., on candy, costumes, and decorations) and multiplier effects, such as job creation and supply chain boosts.
Historical Growth in Spending
Spending on Halloween has shown consistent upward momentum, even amid economic pressures like inflation, due to its “recession-resistant” appeal as a fun, low-stakes ritual. Key figures illustrate the trend:
|
Year
|
Total Projected Spending
|
Average Spend per Participant
|
Notes
|
|---|---|---|---|
|
2023
|
$12.0 billion
|
~$108
|
Record high at the time; adult participation exceeded pre-pandemic levels.
|
|
2024
|
$11.6 billion
|
$104
|
Slight dip from 2023 due to inflation concerns, but still above 2022 levels; 72% participation rate.
|
|
2025
|
$13.1 billion
|
$128 (overall average; higher for Millennials/Gen Z at ~$296)
|
New record, up 13% from 2024; early shopping (49% starting before October) signals extended season.
|
This growth—roughly 9% annually on average since 2020—directly correlates with rising interest, including more adults (now over 50% of celebrants) hosting parties, decorating homes, and visiting attractions. The increase has added ~$1-2 billion in incremental spending year-over-year in recent cycles, bolstering GDP contributions from retail (which employs 1 in 4 private-sector workers).
Breakdown of Spending Categories
The surge in interest amplifies spending across categories, with candy and costumes leading the charge. In 2025, projections break down as follows:
- Candy and Food: $4.0 billion (up from $3.5 billion in 2024); confectionery sales alone hit $7.4 billion in 2024, supporting $49 billion in broader industry impact and $10.5 billion in wages.
- Costumes: $4.3 billion (71% of celebrants buying); includes human and pet outfits, with demand driving thrift/DIY trends (22% recycling costumes to offset 8% price hikes).
- Decorations: $4.2 billion (78% participation, up from 75% in 2024).
- Greeting Cards and Other: $0.7 billion (38% buying, up from 33%).
- Experiences (e.g., events, attractions): ~$2-3 billion indirectly via tourism, haunted houses, and pumpkin patches.
This category expansion highlights how heightened enthusiasm extends the “spooky season” into summer (e.g., “Summerween” searches up 2,889% in 2024), creating prolonged retail boosts.
Broader Economic Benefits
Beyond direct sales, the rise in Halloween fervor generates ripple effects:
- Job Creation: Seasonal roles in retail, logistics, and events add tens of thousands of positions; one confectionery job supports 11 others, per the National Confectioners Association.
- Local and Sectoral Boosts: Tourism spikes in areas like Salem, MA, or pumpkin-producing states (e.g., Illinois, California), enhancing hospitality revenues. Agriculture benefits from $200-300 million in pumpkin sales annually.
- Multiplier Effect: Each dollar spent generates ~$1.50-2.00 in economic activity through supply chains, with total GDP contribution estimated at $15-20 billion when including indirect impacts.